DPlot: Graph Software for Scientists and Engineers
DPlot is the leading graphing and data visualization software tool for scientists, engineers, researchers, or anyone else who is interested in plotting complex data. With DPlot, ARA provides even more comprehensive graphic and data visualization services to our clients.
- Features
- FAQ
Some key features of DPlot include, but are not limited to:
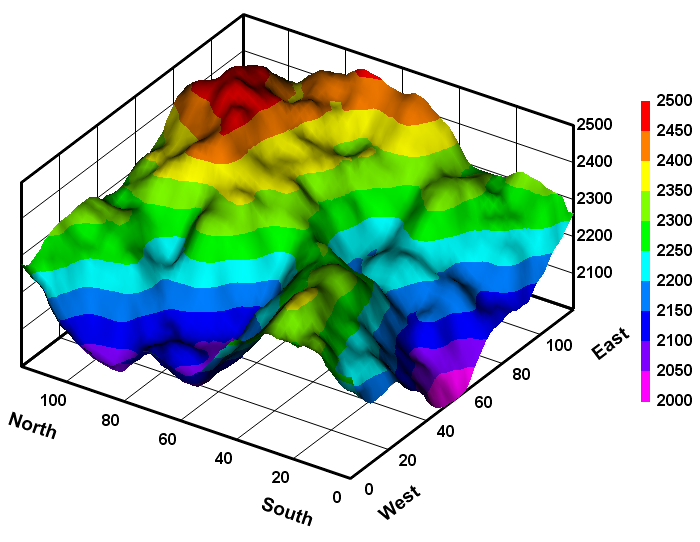
- The ability to display and manipulate one-, two-, and three- dimensional data from a variety of sources in many different formats.
- DPLOT’s straightforward interface will appeal to anybody interested in creating X-Y plots and/or contour plots of 3D data.
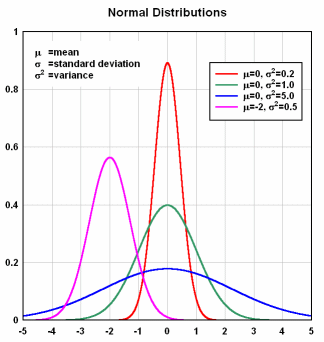
- Generate curves from equations with support for conditional formulas or from one or more existing curves
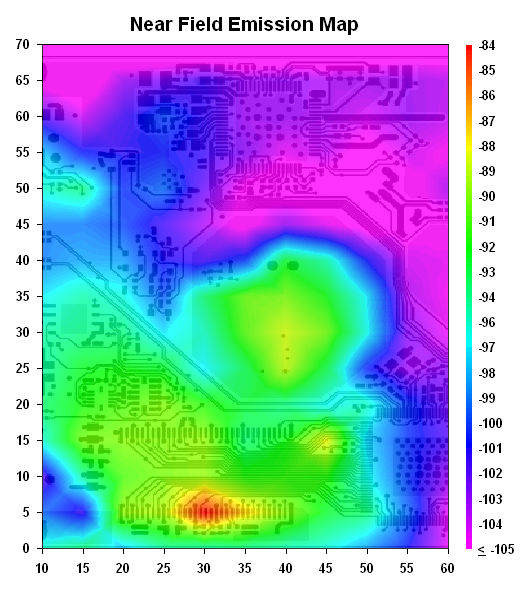
- Support for a background image for your 2D plots.
- Bar charts
- Multiple independent or dependent scales.
- 3D scatter plots with colors based on Z value or data set.
- And much more…
Specifications
- The software is compatible with Windows XP, 7, 8, 10, or 11
Join the conversation
buy now
You are now entering ARA's Secure Online Store
Renewal
You are now entering ARA's Secure Online Store
Free trial
Contact SEASINFO@ara.com for a fully functional time-limited demo.
We frequently work with plots containing several curves and 2 million or more points per curve. The actual limit is determined by the largest continuous block of free memory (generally less than 2Gb minus the overhead of DPlot’s code+resources and any DLLs that have been loaded). On most systems (with sufficient RAM and/or virtual memory) you will be limited to about 70-90 million points.
If your files are XY data with X values in the first column and all subsequent columns being Y values for separate curves, you can open your CSV files in DPlot and it will correctly interpret them, including (if present) titles and axis labels (for a single curve) or legend entries for multiple curves. DPlot includes support for 3D (X,Y,Z) data and for XY. “CSV” is actually a bit misleading in this case, as DPlot will also allow tab- or space-separated columns. DPlot will also allow you to save your data to a CSV file that can be read directly by Microsoft Excel.
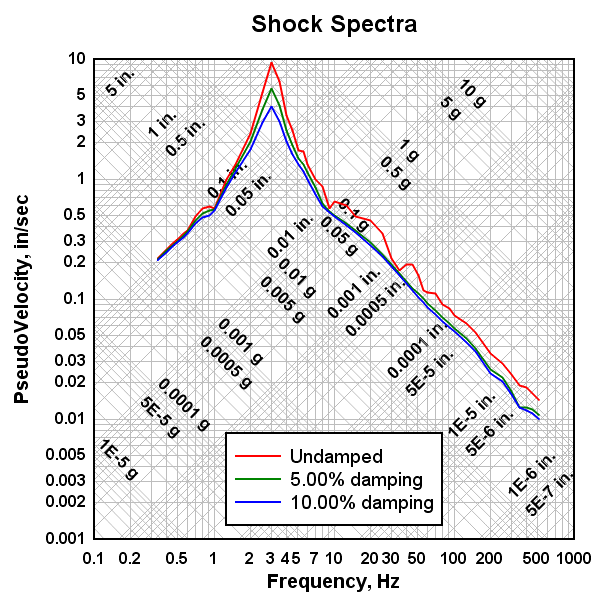
Normally, values on a linear or logarithmic scale increase from left to right (or bottom to top). You can change the direction by selecting the Extents/Intervals/Size command on the Options menu and checking the appropriate “Invert” checkbox below “Specify Extents”. For example, if your logarithmic scale on the X axis normally extends from 1 on the left to 1000 on the right, check “Invert X” to change the extents to 1000 on the left, 1 on the right.
For 3D data you can achieve similar results by specifying negative scale factors for the appropriate axes with the Contour Options (for surface plots) or Scatter Plot Options (for 3D scatter plots) commands under the Options menu.
In this context, by “scatter plot” we mean a plot with symbols at each data point, and no line segments connecting the data points.
Select the Symbol/Line Styles command on the Options menu. For all curves, choose “0 – none” for the line type, and select the symbol type you want to use for each curve. The Symbol/Line Styles dialog is also used to set the size and frequency of symbols.
By far the easiest way is to link your program with DPLOTLIB.DLL. This developer’s tool is included with the DPlot Jr as well as the full DPlot distributions and also as a separate download. DPLOTLIB works with either the full version of DPlot or DPlot Jr (it will always choose the full version if both are installed). Example programs with full Visual Basic (C and FORTRAN, too) source code are included. Documentation is included with the distribution and is also available online.
VB users please note: You do not need to add a reference to DPLOTLIB.DLL in your VB project. That VB feature only works with COM modules, which DPLOTLIB.DLL is not, and attempting to add a reference will only result in an error from VB. If you follow the example programs you should not have a problem, but if you do, let us know.
Or, for that matter, any of the Microsoft Office products? Very easily. Use the Copy command (or corresponding toolbar button or shortcut key) to copy your plot to the clipboard, then paste into the target program. For XY plots DPlot creates digital image representations of your plot. The size of the image will be based on the specified extents for the plot with a print resolution of 300 pixels per inch.
The short answer is… you can’t, at least not initially. DPlot is only reading X,Y,Z values from your input source, whether that source is a file, the Windows Clipboard, communication from another program, or the Edit Data command. This is not enough information to determine where the edges of the surface should be, or for that matter to determine whether your surface should have any interior holes. DPlot always creates a convex triangular mesh from X,Y,Z input, which for many applications is exactly what you want. It is of course possible that you will not want a convex mesh. In this case DPlot will have created triangles outside the desired limits of your plot. The solution is to use the Define Boundary menu command to describe the exterior boundary of your surface.
Waterfall plots can be created directly from 3D points on a rectangular grid – for example points generated with the Z=f(X,Y) command. But in most cases you’ll start with random 3D points, for example X,Y,Z columns pasted from the clipboard, and the waterfall plot option will be disabled. To reorganize these points on a rectangular grid, use the Generate Mesh command on the Options menu. This command gives you several options controlling the complexity of the grid and the smoothness of the generated mesh. After running Generate Mesh you’ll find that the waterfall plot option is now enabled for 3D plots.
In short, no. If you are interested in incorporating DPlot functionality into your software program, contact us for more information on a developer license (allowing you to redistribute DPlot with your application) and/or a bulk licensing scheme taking advantage of multi-user price bands with purchases spread out over future years.
All e-mail inquiries are answered as soon as possible, generally within one business day. If you are not receiving answers to DPlot support questions or you are a licensed user signed up for the DPlot update mailing list and are not receiving update notices, it is almost certainly due to the mail being blocked by your mail server, whether it is erroneously flagged as spam, or being held on the server because support@dplot.com is not on your “whitelist”. Free e-mail accounts (e.g. yahoo, hotmail) are especially bad about this, as are selected paid accounts – in particular comcast. This situation is not likely to improve as long as the world is plagued with spam. Best suggestion for support questions: use the DPlot to post your question. If you do not want to post your question publicly you can post a private message after registering on the Forums.
